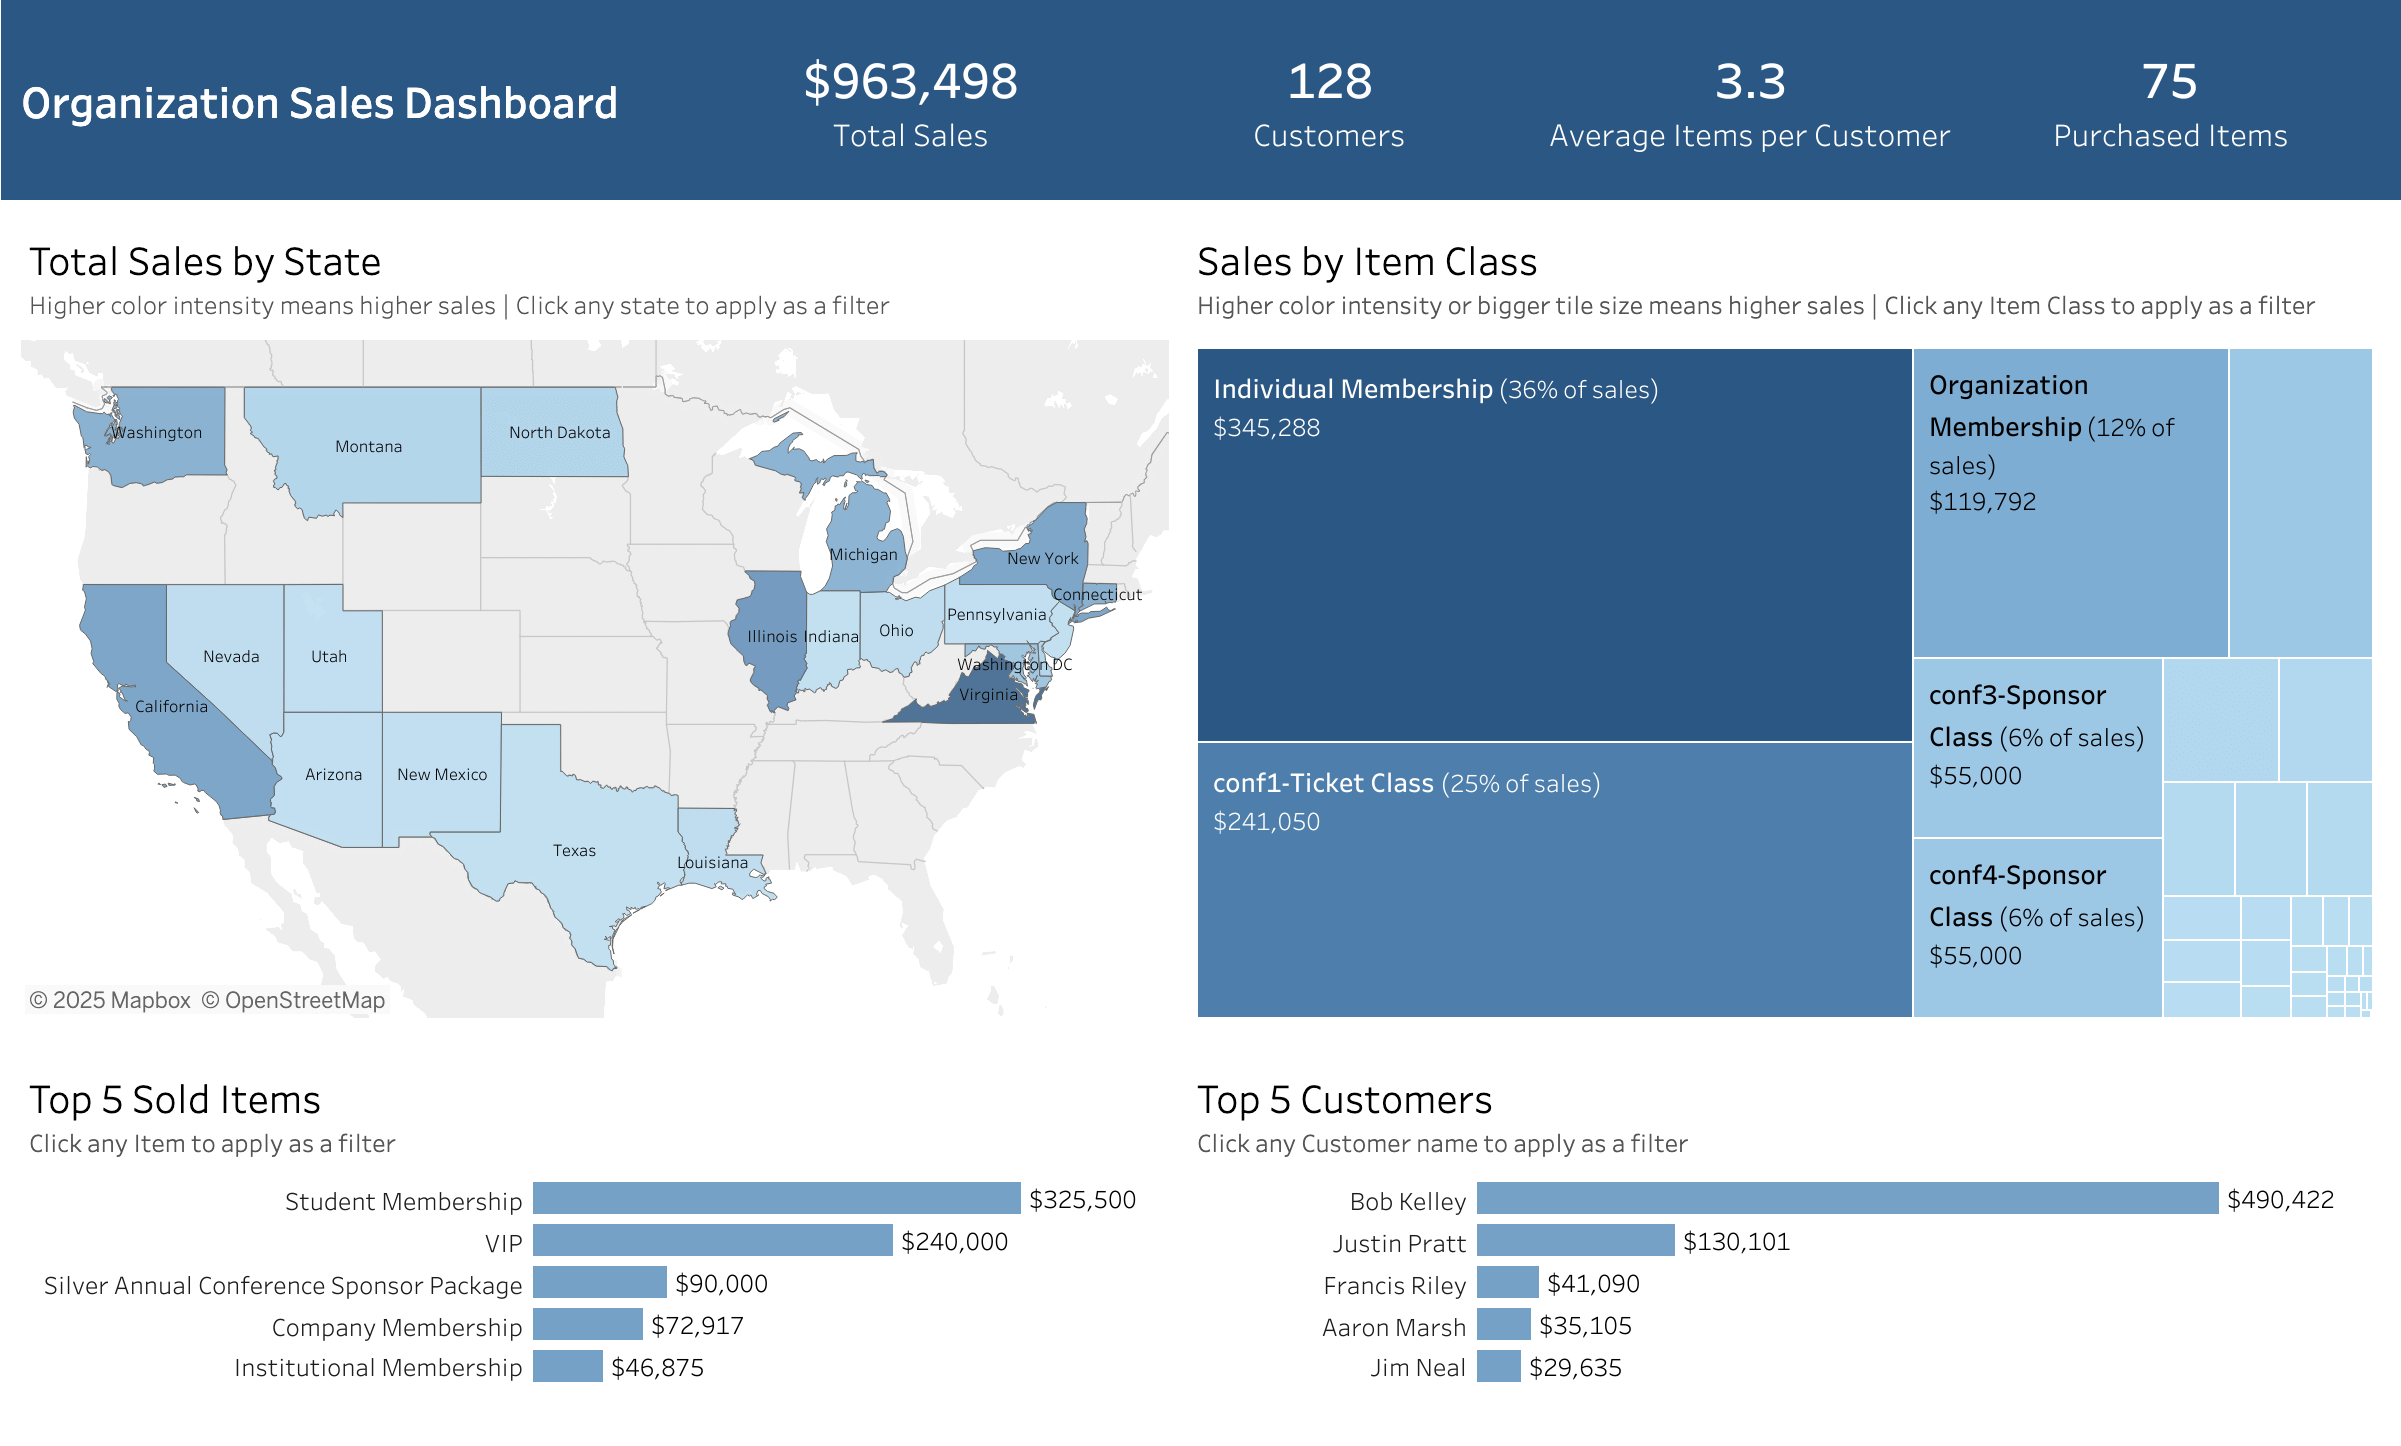
In today’s data-driven world, the ability to analyze and visualize data effectively is crucial for making informed decisions. Tableau is a powerful tool designed to meet this need, but it is essential to understand what Tableau is, how it works, and how it differs from other tools like Salesforce reports. This article will provide an overview of Tableau and its benefits, particularly for non-profit organizations and associations.
The fusionSpan Blog
Getting familiar with Tableau


What is Tableau
Tableau is a leading data visualization and business intelligence (BI) tool that helps users create interactive and shareable dashboards. These dashboards allow non-technical users to understand, explore, and analyze data easily.
Since its foundation in 2003, and having been acquired by Salesforce in 2019, Tableau’s mission has remained the same: to help people see and understand their data and empower them to drive change with data.
Tableau’s primary strength lies in its ability to simplify complex data analysis through intuitive and visually appealing dashboards. It is user-friendly, enabling individuals with little to no technical background to create detailed and interactive visualizations.
Tableau can connect to various data sources, including Excel, CSV files, SQL databases, and cloud-based data warehouses and services like Google Analytics, Salesforce, and Amazon Redshift, allowing for comprehensive data analysis.
What Tableau is not
It is also important to get to know what Tableau is not:
- A Data Storage Solution: Tableau is not designed to store data. It connects to existing data sources to retrieve and visualize data.
- A CRM: Tableau is not a Customer Relationship Management (CRM) system. It does not manage customer interactions, but it can analyze CRM data.
- A Static Reporting Tool: Unlike traditional reporting tools, Tableau offers dynamic and interactive visualizations that allow users to drill down into data for deeper insights.
What Tableau is Best For
 Tableau excels in several areas:
- Data Visualization: It is best known for creating stunning and interactive data visualizations, offering a wide range of charts, graphs, and other visual formats that make data easy to understand, explore, and communicate.
- High level of customization: Tableau offers great flexibility in customizing visualizations to meet specific needs, allowing users to tailor dashboards and reports to their unique requirements.
- Ease of Use: The drag-and-drop interface makes it easy for users to create complex visualizations without any programming knowledge, making advanced analytics accessible to non-technical users.
- Data Integration: Tableau can connect to a wide range of data sources, including Excel, SQL databases, cloud services, and more, enabling comprehensive and integrated data analysis. It can be a single BI tool for multiple data sources.
- Strong Community Support: Large, active user base that shares tips, resources, and best practices, along with extensive online resources and professional support.
- Self-Service Analytics: Tableau empowers users to perform their analyses without needing constant support from IT, fostering a culture of data-driven decision-making within the organization.
- Mobile Access: Tableau offers a mobile app that enables users to access reports and dashboards directly from their mobile devices.
How Tableau Differs from Salesforce Reports and Other BI Tools
Salesforce reports are built within the Salesforce CRM platform. While they are useful for basic reporting and tracking key metrics, they have limitations in terms of data visualization and advanced analytics.
- Scope: Salesforce reports are typically limited to data within Salesforce, whereas Tableau can connect to multiple data sources.
- Visualization: Tableau offers more advanced and interactive visualization options compared to Salesforce reports.
- Flexibility: Tableau provides greater flexibility in terms of customization and data exploration.

Compared to other BI tools like Power BI, QlikView, or Looker, Tableau stands out for its robust visualization capabilities and ease of use. Each tool has its strengths, but Tableau is often favored for its intuitive interface and the quality of its visual outputs.
Staff and Training Requirements for Tableau
 To fully leverage Tableau’s capabilities, an organization needs to consider the following staff roles and training.
Staff Requirements
-
Data Analysts: Professionals who understand data and can build complex visualizations. They are responsible for interpreting data, creating dashboards, and generating insights that support decision-making.
-
BI Engineers or Administrators: These professionals monitor and support Tableau servers and infrastructure. They are responsible for the installation, configuration, and maintenance of Tableau Server or Tableau Online. They ensure that the system runs smoothly, manage user access, and optimize performance to handle the organization’s data needs.
Training Requirements
-
Initial Training: Basic training sessions to familiarize users with Tableau’s interface and functionalities.
-
Advanced Training: For users who need to perform more complex analyses and create advanced visualizations.
-
Specific Training for BI Engineers/Administrators: Detailed training on Tableau Server administration, including installation, configuration, security management, performance tuning, and troubleshooting. This ensures that the Tableau environment is robust, secure, and efficient.
-
Ongoing Support: Continuous learning opportunities through webinars, online courses, and Tableau’s extensive community resources.
Support from fusionSpan
fusionSpan is a trusted support partner for Tableau, offering specialized assistance to clients considering starting to use Tableau as well as those already using it. They provide a range of services, including implementation, customization, and ongoing support to ensure organizations can fully utilize Tableau’s capabilities. By partnering with fusionSpan, non-profit organizations can access expert guidance and support tailored to their specific needs, helping them maximize the impact of their data analysis efforts.
Conclusion
Tableau is a powerful tool that can transform how non-profit organizations analyze and visualize their data. By understanding its capabilities and requirements, organizations can make informed decisions about integrating Tableau into their data strategy. With the right staff, training, and support from partners like fusionSpan, Tableau can help non-profits unlock valuable insights from their data, leading to better decision-making and greater impact. By raising awareness of what Tableau is and how it can be utilized, non-profit organizations can enhance their data-driven approaches and achieve their missions more effectively.


