The fusionSpan Blog

Development Tips For Your PowerBI Dashboard

Author Image
By Jason Cookman |May 21, 2020
Integrations

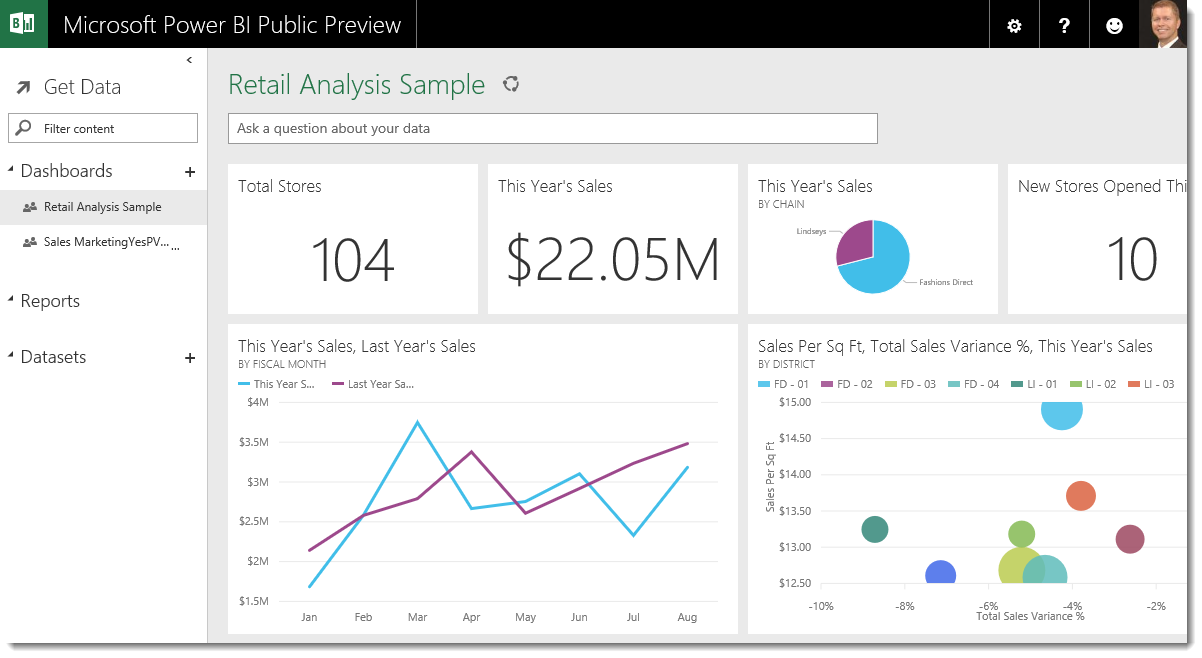
PowerBI is a powerful tool that is able to handle both data transformation and data visualization. In recent years, the developers behind PowerBI have introduced PowerBI online: a new cloud solution where offline PowerBI Desktop users can upload their dashboards and share it with other licensed users.

While the new solution is quite useful, PowerBI does contain certain limitations that Desktop users should be aware of. Check out the following tips on what Desktop users should pay attention to before uploading their dashboards.

1: Try to Limit How Many Steps You Include in a Query

Regarding dashboards, PowerBI Desktop users are only limited to the computing power of their desktop PC. Meaning they can run as many query steps as possible, and would only run into performance issues when their PC could not handle it.

The same cannot be said with PowerBI Online. If your query includes 15 steps for PowerBI Desktop, then expect errors or long run times once you upload your dashboards to PowerBI Online. The Online version relies on Cloud Computing to run its queries, and all services provided below “Premium” usually have limited capacity.

From personal experience, try not to include more than 10 steps per query.

2: Shrink Your Data to Increase Refresh Speed and Save Space

Data pulled from a ERP or CRM system can be massive, with millions of rows of data and up to hundreds of columns. If you want your PowerBI Online dashboards to refresh quickly, then it’d be best to delete all unused columns and limit how many rows you import. For instance:

  • if you have 20 years of data pulled in, consider limiting your data to 5 years of data
  • If you are connected to a SQL database, create a “view” that summarizes that data in the database for you first then import the summarized data into PowerBI.
  • If you have 300 columns, and only use 5 columns for your calculations, delete all the remaining columns or utilize the advanced query option to only pull in data in the 5 columns if you are connected to a SQL database.

Check your online storage space often to make sure your dashboard isn’t pulling in too much data, which would exceed your Data Capacity Limit of 10 GB. Your dataset has a 1GB limit so make sure your dashboard doesn’t hit that limit as well when pulling in data.

powerBI dashboard

3: Simplify Your Dashboards and Spread Content Out

One thing that may also slow down the performance of PowerBI online Dashboards are DAX formulas. While DAX formulas take up very little resources, if there is an alternative to DAX, like built-in table features, use those instead of the DAX. Having too many DAX formulas in your dashboards can drastically slow things down.

Another thing to take note of is to not squeeze all your panels in the first dashboard. Having too many panels rendered in the first dashboard page not only slows things down but also makes it hard for the user to distinguish the information in the dashboard, as everything is too crammed together. Ideally only include three to four visualizations in each dashboard page. Also, include filters in each page to allow users slice and dice their data.

4: Subscribe to PowerBI Newsletters

PowerBI is a tool that’s constantly evolving. Subscribing to relevant newsletters gives you insights for new game-changing features that have been added. For instance, PowerBI Online now includes dataflow, which is an ETL tool that works similarly to PowerBI Desktop’s query/transform mode. This allows more flexibility in your data cleaning process.

Consider checking out the official Microsoft PowerBI site to register for their weekly updates. Other resources like sqlbi and PowerBi Weekly offer regular tips and white papers surrounding the platform. Brushing up on new updates and tips can help you fully harness the power of your system.

5: Always Build a Proof-of-Concept Before You Build the Real Thing

Always Build a Proof-of-Concept Before You Build the Real ThingProof-of-concept is to make sure that the PowerBI Online App you are building includes everything you need for it to work. Not doing a proof-of-concept may cause you to miss certain key issues in the app development process. For example, if you want to schedule PowerBI to refresh without using PowerBI DataFlow, then you have to host a gateway on a secure windows PC. Thi is so that the data is able to be imported through that gateway to your PowerBI online app. If you had not tried this out as a Proof-of-concept, you might have assumed that uploading the PowerBI app is enough to schedule your data refreshes.

In all, PowerBI developers not only need to make sure their metrics are calculated correctly, but they also need to think about time and space. Time refers to the time it takes to load a dashboard; Space refers to the ETL process: how to clean and store the data needed to be used in their metrics.

Thus it is important for them to pay attention to the features and limitations of the apps they are using. It is best to test things out as often as possible, go through the app’s documentation, and plan out the dashboard building process.

Jason Cookman
Development Tips For Your PowerBI Dashboard

Jason is a Senior Salesforce Architect and has been with fusionSpan since June 2014.He has multiple Salesforce Certifications and has led the solution architecture on dozens of Salesforce implementations. In addition he has created apps on a variety of platforms and frameworks including MuleSoft, Spring Boot, AngularJs and Drupal. He has been coding in Java, php and JavaScript for more than eight years and has over six years of experience developing on the Salesforce Platform in Apex, Visualforce and Lightning. He is a graduate of the University of Maryland with a double bachelor degree in Computer Science and Accounting. Jason's favorite foods are ramen, ramen and more ramen.

More posts