The fusionSpan Blog

Superset – An Open Source Dashboard Builder

By Alan Luo |June 18, 2020
Innovation Lab

Apache Superset is an open source, enterprise-ready Business Intelligence (BI) tool for building dashboards. It was developed by Airbnb with the philosophy that “data access should be democratized to empower every employee in order to make data informed decisions”.

Superset users are able to connect to a variety of data sources, such as relational database management systems (e.g. mysql, sql server), Enterprise Data Warehouses (e.g. AWS Redshift) and online apps (e.g. Google Sheets) for reporting purposes.The ability to query data from different sources gives Superset users the opportunity to visualize a vast array of data.

New call-to-action


We have been using Superset here at fusionSpan for quite some time, and offer it as one of our BI services to associations. One major benefit of having Superset is that you are not limited by licensing fees. Users can distribute their dashboards to a large group of people without incurring extra costs. To assist clients with using Superset to its fullest potential, fusionSpan also offers cloud hosting management, installation, dashboard creation and ETL services alongside the original Superset application. This ensures that our clients can focus on the business aspect of Superset and not have to worry about IT infrastructure. In this article, we will share with you some information on how Superset is used and the major benefits it has in bringing data insights to users.

The Components of Superset

The design of Superset revolves around three main components:

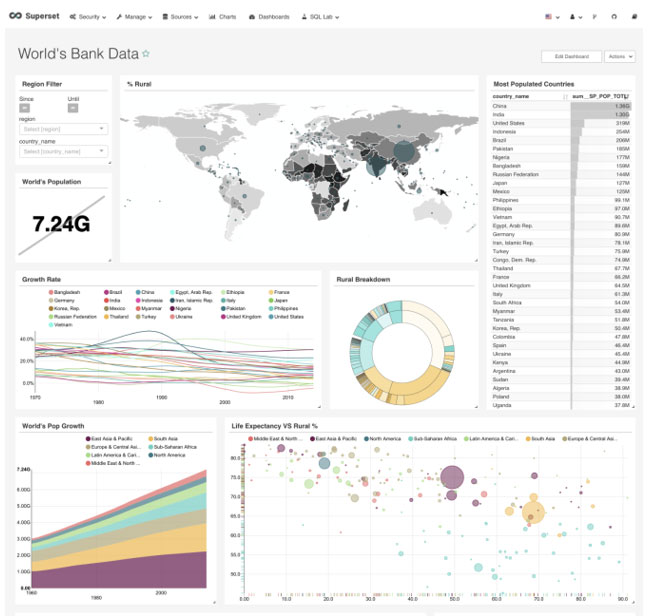
  1. The visual dashboard: where users add, arrange and resize their visuals.
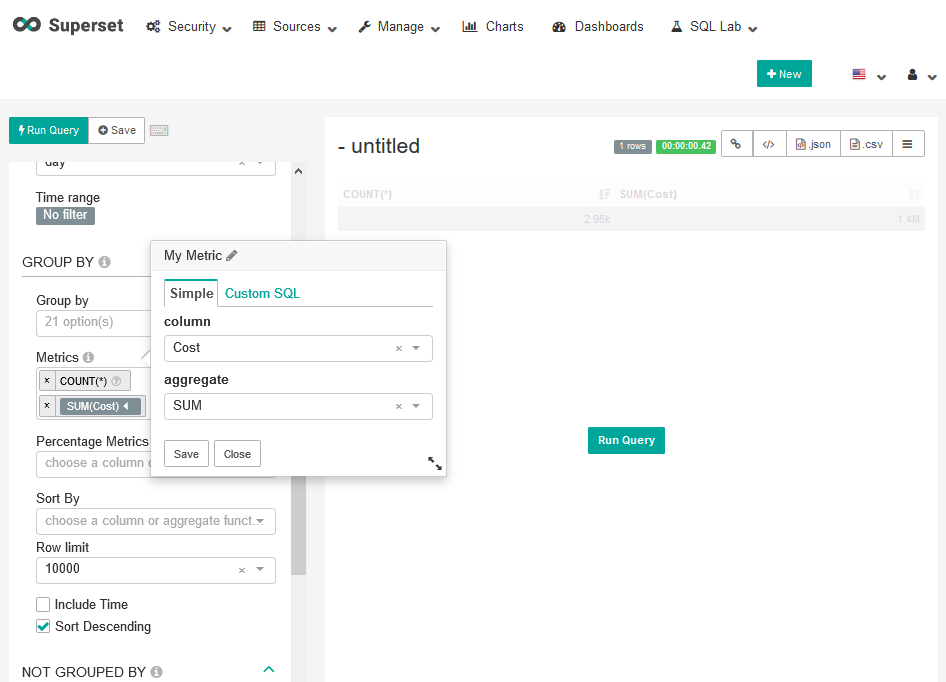
  2. The data explorer: where users slice their data and turn them into panels.
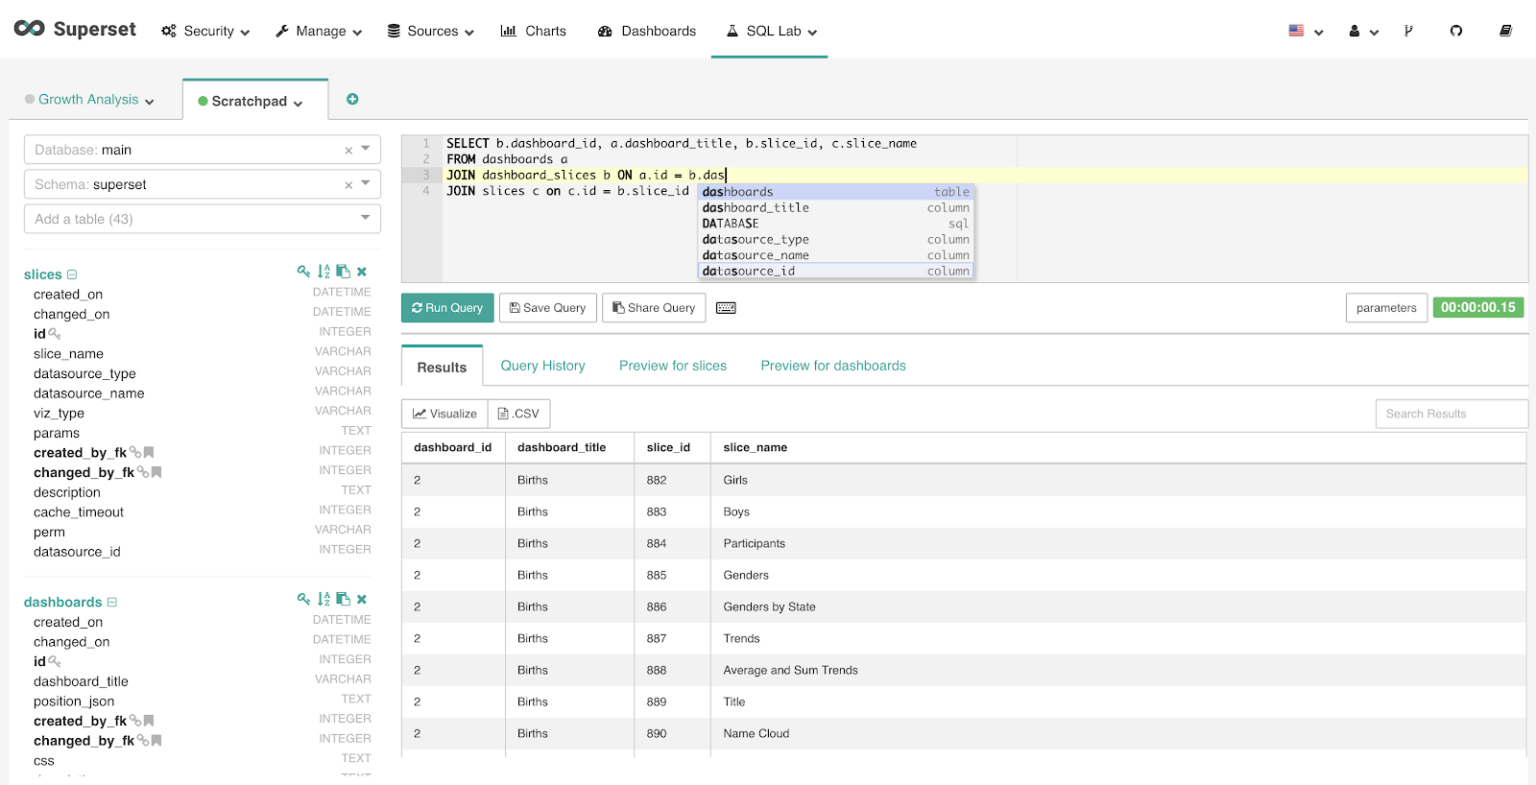
  3. The “SQL Query Lab”: an SQL IDE where users add virtual views on top of their data source to restructure the data.

This arsenal of data tools in Superset can help users tackle most challenges in the Dashboard development process.

Building dashboards in Superset is very straightforward. Users first connect to a data source, then they run a SQL query, after that they slice and dice the data in the Superset Data Explorer and finally they publish the visualizations onto a dashboard.

There are also a lot of features that are included within this toolbox. If a multi-tab dashboard is needed, Superset allows users to add tabs and rename them in the dashboards. If a tree map needs to be changed into a pie chart, the Explorer is the correct tool to use. If two tables from different sources need to be joined, SQL Lab allows you to create queries to join the datasets together. Many of the features Superset provides allows quick deployment of visuals and are fairly easy to use.

Security and Sharing

Dashboards in Superset can be shared to the public or internal users. Within Superset, dashboard sharing is done through user tagging. A user is tagged with a role that has certain policies and specific data source accesses attached to it. The process is simple, but it is important to understand what policies are needed and the effect it has on a user’s ability to access dashboards.

First, understand what policies are needed and what effects it has on a user’s ability to access dashboards. Second, create a role that has all the necessary policies/rules attached. Third, attach that role to the public user for public display or an internal user for single user display.

Our team at fusionSpan was able to identify a list used to create “read only” + “allow download” user roles. To allow a user to read and download data, you need to first give them access to the data source behind the dashboard, the tag similar to:

  • datasource access on [main].[data_source] (id:1)

Then assign them a role that contains the policies below:

  • can explore json on Superset
  • can explorev2 on Superset
  • can explore on Superset
  • can csrf token on Superset

Once these roles are assigned, users can see the dashboard built on top of the data source and will be able to export CSV formatted data that runs behind the dashboard.

Queries and Calculated Fields

SQL Query Lab is a really powerful tool within Superset. It creates a virtual view wrapper around your datasource and allows you to query and reshape your data however you like. Most SQL query functions such as Common Table Expressions, Window Functions, Joins all work within SQL Query Lab.

Once you’ve written a query and you can CONCAT data or add CASE Conditions afterwards though the calculated fields and metrics in the Superset Data Explorer.

These fields can be adjusted, deleted or re-added and the dashboards will automatically reflect these changes immediately after the visual is saved. This gives the user flexibility in adding or adjusting the slices being displayed.

Dynamic Filters

Filters by default sync throughout the dashboard. In other words, filters will apply to all slices belonging to the same data source within a dashboard. As we have learned during development, filterboxes affect all visuals within a dashboard. A filter applied under one tab will automatically be applied in another tab.

To make sure certain visuals do not change due to filters, Superset allows you the option to lock your slices by adding their id number to a list. If you don’t want certain visuals to be filtered on your dashboard, you’ll have to edit that specific slice’s JSON Metadata.

{
“filter_immune_slices”: [324, 65, 92],
“expanded_slices”: {},
“filter_immune_slice_fields”: {
“177”: [“country_name”, “__time_range”],
“32”: [“__time_range”]
},
“timed_refresh_immune_slices”: [324]
}

The Superset documentation gives an example above, where visuals with id of 324, 65 and 92 are immune from dashboard wide filters. The JSON Metadata also shows that 32 is immune to only time_range filters and 177 is immune to both country and time_range filters. This gives you total control over what your filters can or can not do.

Overall, Superset is an amazing open source platform for BI development that gives you tremendous control over the dashboards you create. The intuitive dashboard interface, the robust out of the box SQL IDE, the easy-to-use data explorer and the extensible rule-based security model, are all robust features that Superset includes that gives users the ability to build and display a wide array of beautiful visualizations, bringing about insight and transparency.

The app has great potential in helping users deep dive into their data. With the right setup, associations can leverage Superset to visualize membership growth, financial situations and marketing effectiveness in just one location. You can find more documentation here , or contact fusionSpan directly for more information and best practices today!

New call-to-action
Alan Luo

Alan has been working in the field of Ecommerce for 4 years and has extensive knowledge in Online Marketing and Data Analytics. He has practical experience scraping and cleaning data and has tackled a few data science projects in his career. During his free time, he would listen to 80s pop and J-rock, or would try a few riffs on his guitar.

More posts