Roses are red,
Violets are blue,
We love Salesforce reports
And we hope you do too!
Salesforce provides standard report types which can be used to build reports summarizing and analyzing your organization’s data. Salesforce reports are a powerful tool that helps you and your organization’s staff proactively respond to your organization’s trends and activities.
Hint: If your organization is new to Salesforce, check out our blog post “Common Issues for Organizations New to Salesforce (And How to Avoid Them!)“. If you have any additional questions about report-building, contact our talented Salesforce Customer Success team!
Questions to Ask Before Creating a Salesforce Report
Before creating a report, work with staff requesting the report in gathering report requirements. Consider asking the following questions and use the answers to build your report criteria.
- What question is being answered by building this report?
- What is the intended business use for the report?
- What information is needed?
Once you have your report criteria, you are ready to start building the report!
How to Create a Salesforce Report
In this blog post, we will build a report to pull all active users in your organization who logged in this month.
Note: In this example, we will be using Salesforce Classic. Almost all of these steps can be used to build a report in Salesforce Lightning.
Step 1: Navigate to the Reports Object
Click on the Reports object from the navigation bar

Note: If you cannot find Reports on the nav bar, you can also find it under the All Tabs section by clicking on the + icon
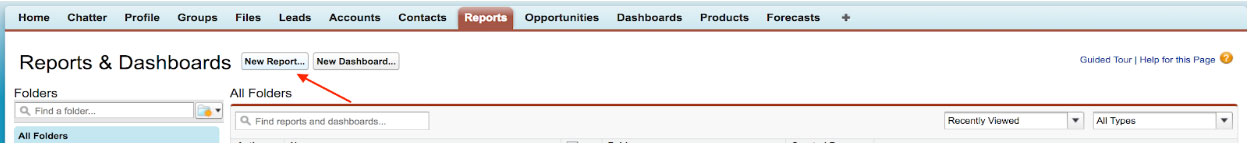
Step 2: Create a New Report
Click on New Report.
Select your report type and click Create. In this example, we are pulling a report on our organization’s Salesforce logged-in users. Expand the Administrative Reports section and select Users.
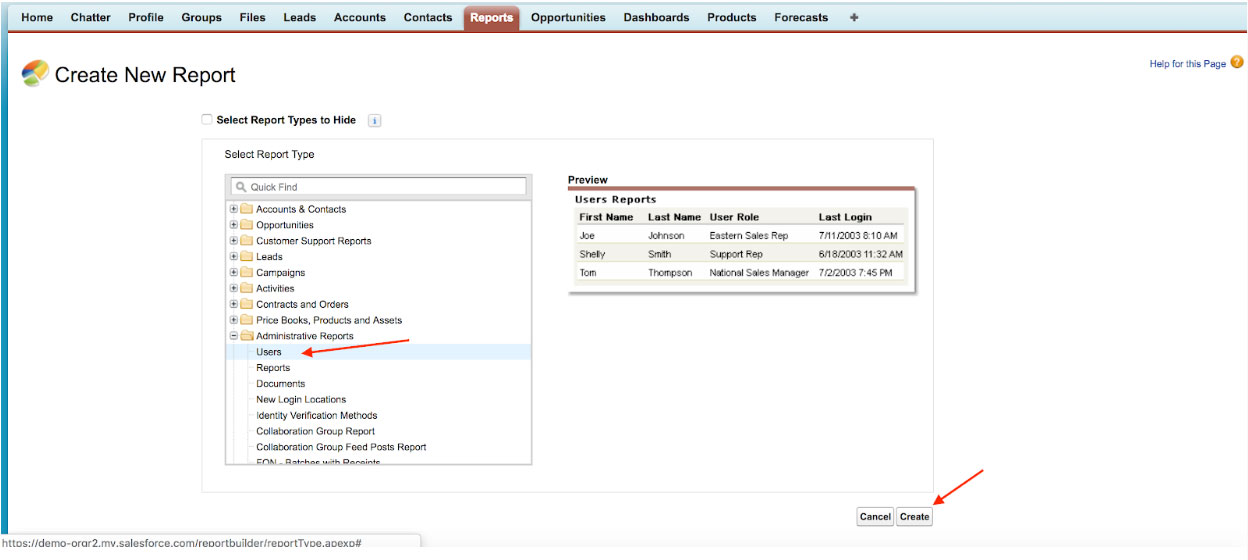
When you click Create after choosing the report type, you will see your preview report screen.
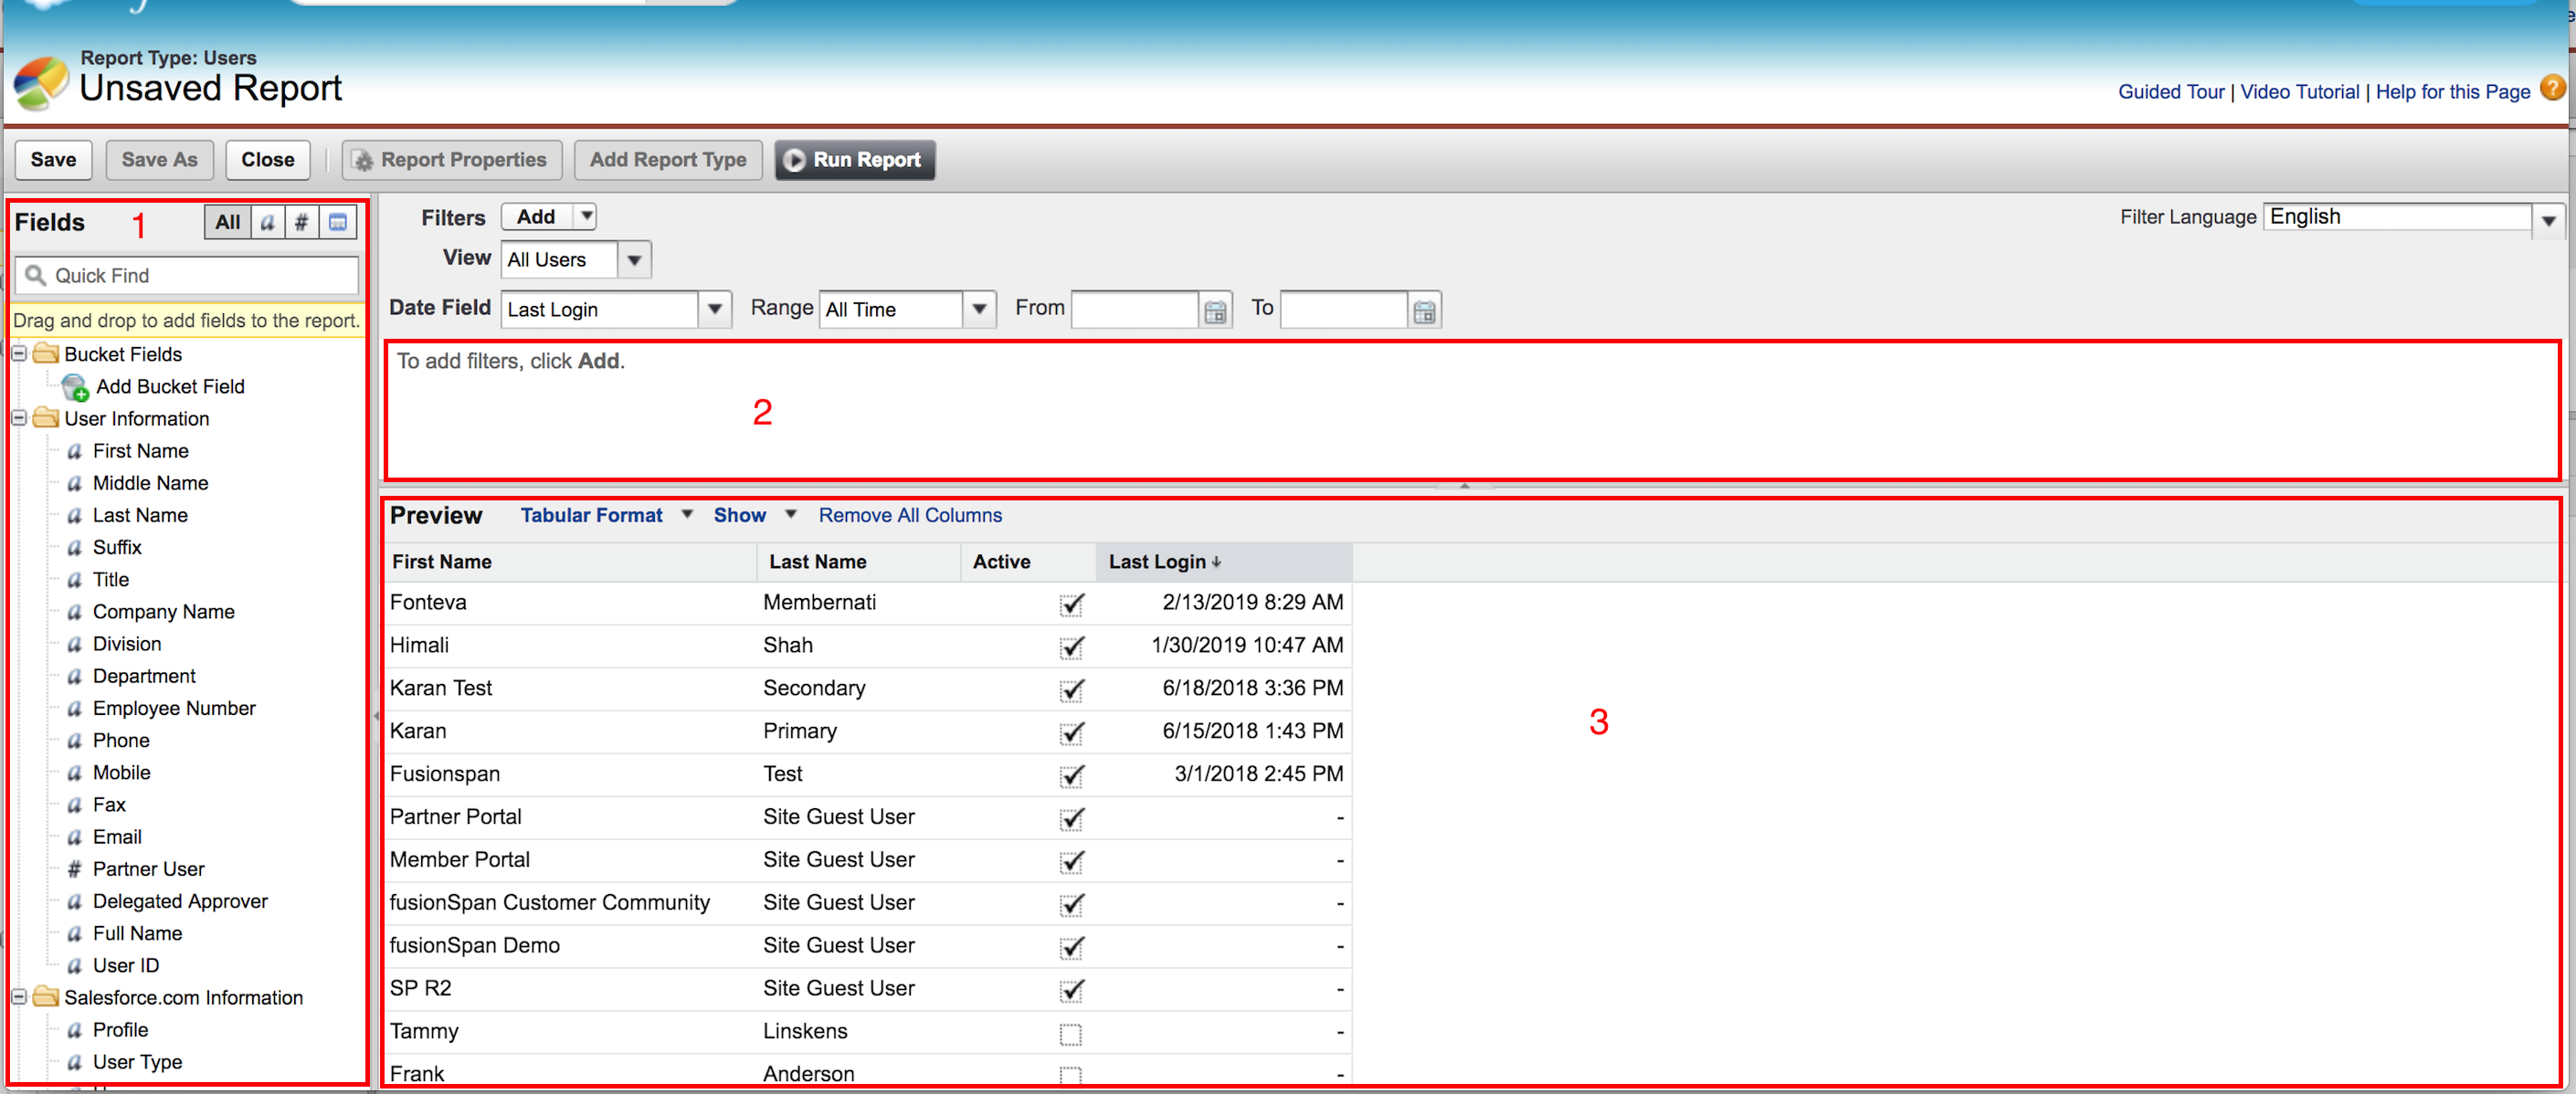
- Fields: Shows the list of fields available for your report. You can drag the fields on the preview (3) section.
- Filters: Create filters to meet your report requirements.
- Preview: Preview your report’s data.
Based on our Logged-In Active User Report requirements, build the report using the following filters:
- View: Active Users
- Date Field: Last Login
- Range: This Month
Additional filters can be created by clicking the Add button. Additional fields can be added to the report by dragging fields from Fields into the Preview section.
Step 3 – Run Report and Save
Report Previews only display 50 rows of results. To view and export the full report, click Run Report. You can also Save the report for future use.
Congratulations! You now have a report to monitor all active users who logged in this month.
There’s so much more you can do with reports, like grouping the records using bucket fields, create a formula field, add cross filters linking the objects, add a chart to your report, choose from the report formats available etc.