
 Members, donors, volunteers, and advocates search for more than promises—they need proof of real change. They want to see the numbers that reflect impact, hear from the individuals whose lives your nonprofit has transformed, and feel confident that their support makes a genuine difference.
Effectively leveraging data can provide the assurance they’re seeking. It brings your organization’s stories to life, connects contributions to tangible outcomes, and builds trust by showing that every action counts. Especially in today’s
digital landscape, using data strategically across platforms is essential to reach and engage supporters.
However, data-backed storytelling takes more thought than picking a few impact metrics, posting them online, and calling it a day. This guide will explore how your nonprofit can use data to elevate stories that inform and inspire supporters, all while strengthening your organization’s brand. Let’s get started!
Collect the Right Data for Storytelling
The core of impactful storytelling is defining the narrative you want to share. Are you highlighting a major success, demonstrating an urgent need, or celebrating progress toward a big goal?
Identify the message that best reflects your communications’ purpose. To ensure your message lands, align it with what your donors and volunteers care about.
For example, if your supporters care about the educational impact of your nonprofit’s literacy programs, your data should illustrate improvements in literacy rates or increased access to educational resources. Sharing data that meets your target audience’s needs will build lasting connections.
Types of Data to Consider
The good news is that you can choose from different types of data to support your story’s message. Here are a few types of nonprofit data to consider:
- Quantitative Data: Gather specific metrics that illustrate impact, such as “90% improvement in literacy rates” or “500 families received support.” These numbers create a foundation for your story and provide a sense of scale. You can collect quantitative data from program tracking systems, CRM platforms like Salesforce, and tools for measuring outreach or resource distribution.
- Qualitative Data: Use testimonials or quotes from people directly impacted by your work. These personal stories add emotion to your data. Gather qualitative data through interviews, surveys with open-ended questions, and focus groups.
- Trend Data to Show Growth or Need: Highlight growth or trends over time (e.g., “services provided increased by 40% since last year”). This tells your audience about progress or urgency in your cause. Gather trend data by consistently tracking program and fundraising metrics over time, comparing results from recurring surveys, and checking community or sector reports.
Shared data should align with your nonprofit’s mission, helping create a story with purpose and authenticity. Just make sure you have the right tools to streamline and automate data collection and insight generation, such as your CRM, survey software, analytics platform, program tracking system, or external reports.
Transform Data Into Visual Stories
Especially as information floods today’s online landscape, your nonprofit needs to make its stories stand out. Images are a great way to do just that!
Marketing research shows that people only remember about 10% of information three days after reading it as text. They remember 65% of that information when paired with an image, underscoring the importance of imagery for effective marketing.
Try these visuals to make your stories memorable:
- Infographics and Progress Graphics: Create visuals that combine key figures with icons, illustrations, or photos to communicate impact at a glance. For instance, an infographic displaying “3,000 meals provided” paired with an illustration of a meal conveys scale, while progress graphics, like a bar showing an “80% increase in clean water access,” showcase growth in an easy-to-interpret way.
- Comparative Images: Before-and-after photos showcase progress, especially when paired with quantifiable data. For example, a nonprofit focused on disaster response could show a “before” photo of a deteriorated home and an “after” photo of that same home rebuilt alongside a metric like “200 homes rebuilt.” This highlights the improvement in living conditions and the scale of impact.
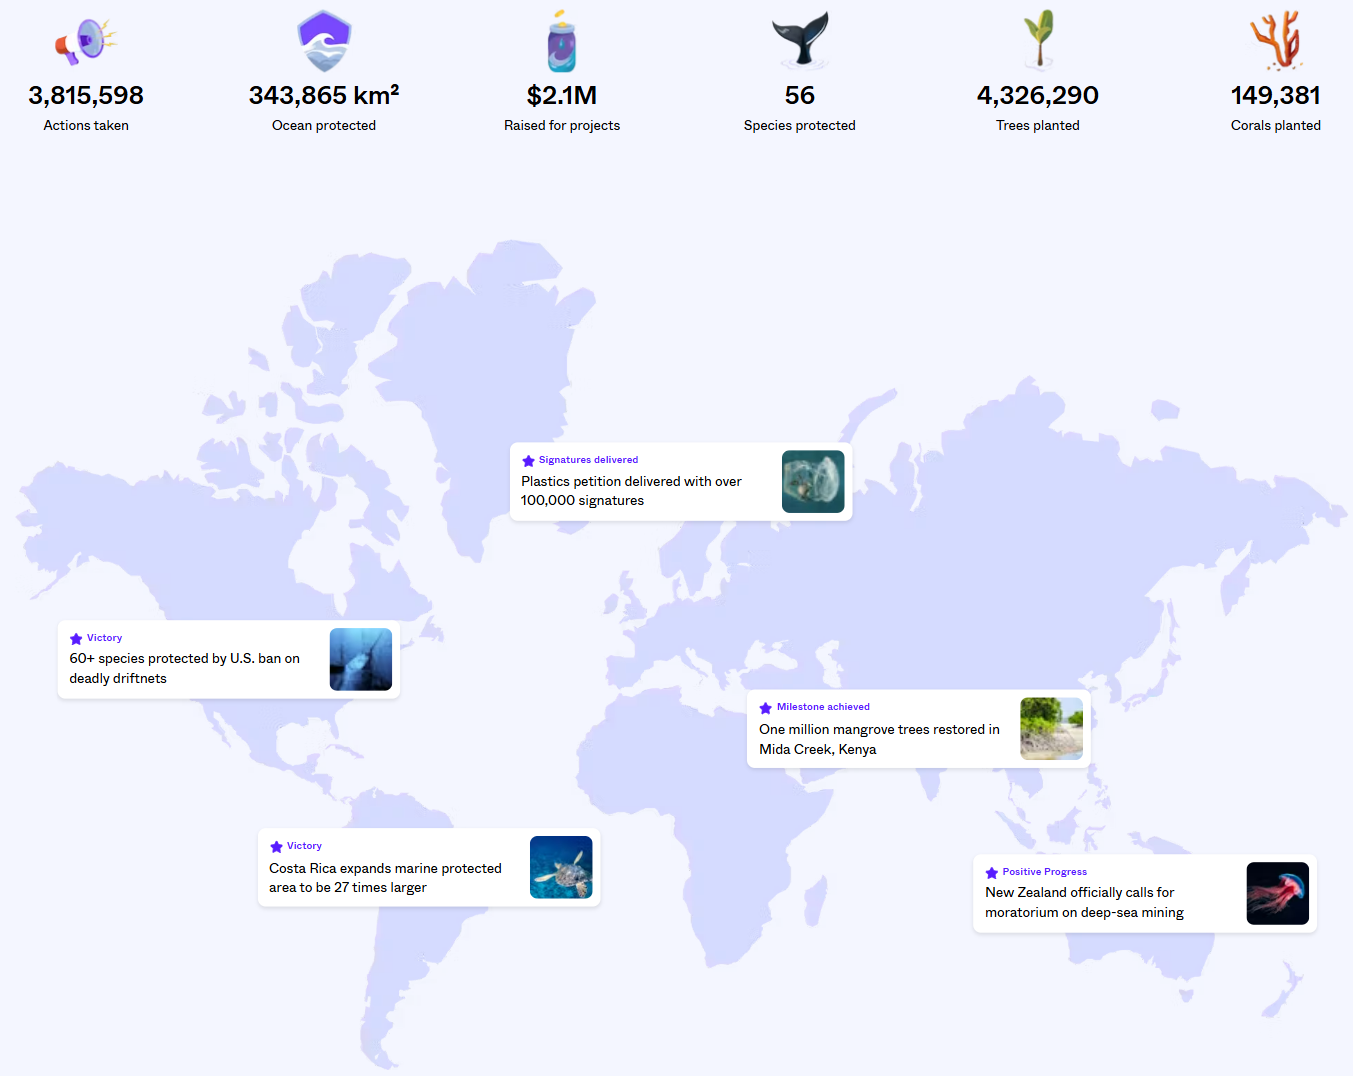
- Interactive Maps or Timelines: Interactive timelines can illustrate the growth of programs over time. Meanwhile, maps empower supporters to explore the geographical reach of your work. Loop’s best nonprofit websites guide highlights how Only One lets its audience visualize its global impact on pressing environmental issues with a map that emphasizes statistics like “60+ species protected by U.S. ban on deadly driftnets” and “one million mangrove trees restored in Mida Creek, Kenya:”

You can use tools like Canva to make these images or outsource the work to a creative design agency. Professionals have the creative eye needed to bring your data to life in a digestible way. They’ll know which visuals will best convey the data you want to share, whether it’s an in-depth infographic or a dynamic map embedded into your website.
Share Data Across Digital Platforms
By weaving impact stories into various marketing channels, your nonprofit can build transparency and keep supporters updated. Incorporating data-driven marketing techniques allows you to strategically share information across platforms to reach a targeted audience.
Here is a quick overview of how to effectively leverage different platforms to tell your story, showcase impact, and ultimately transform your digital strategy.
1. Use social media for bite-sized impact.
Post simple data points that capture attention. For instance, pair a statistic like “75% success rate in our job training program” with a brief testimonial from a program participant to make it relatable and meaningful.
Use a combination of visuals—such as infographics, photos, and short videos—to present data in a way that catches your audience’s attention and aligns with your chosen platform. Regularly updating followers with data-centric posts helps maintain engagement and encourage shares.
2. Create detailed impact web pages.
Dedicate a section of your website to data-rich impact stories, blending visuals with narratives that showcase notable outcomes. This section can feature updates on key initiatives, program achievements, and detailed impact statistics.
Try these elements to make your impact page informative:
- Program Highlights: Break down major initiatives with key metrics like “1,500 students received essential school supplies last year.”
- Interactive Visuals: Use infographics, progress bars, interactive maps, and timelines to show reach and milestones.
- Impact Stories: Feature short stories or links to case studies about those affected by your work.
Treat this page as a living document by regularly updating it with new data and stories. For a professional look, collaborate with a web design agency to bring these elements together in a cohesive and visually appealing layout.
3. Send emails for consistent engagement.
Use email as an opportunity to showcase program growth, milestones, and upcoming goals. In updates and thank-you messages, highlight important data points with brief stories.
For example, a monthly newsletter could include a blurb like, “With $50,000 raised last month, we provided 250 children with educational supplies, including Sarah, who is now thriving in the classroom.” This blend of data and narrative personalizes impact.
4. Release a digital annual report.
Create an interactive annual report that pairs data with compelling stories from the past year. This report reviews your nonprofit’s recent work, providing a clear picture of your achievements and needs.
Getting Attention’s guide to nonprofit annual reports highlights several real-world examples of compelling reports. The 2023 World Wildlife Fund (WWF) stands out as particularly effective from a data-backed storytelling perspective. The report infuses statistics into compelling stories about key initiatives, such as protecting endangered wildlife and safeguarding freshwater resources.
For example, a story about rhino conservation uses statistics such as how, over the past 30 years, 86 conservancies have been built in Namibia, home to the world’s largest population of black rhinos. Thanks to these conservancies, which WWF played a big part in developing, no rhinos were poached in 2022.
Data-infused stories turn abstract impact into an inspiring narrative. Strong visuals will make these stories even more impactful, whether you’re posting a photo of a kid receiving school supplies with a statistic about how many students you’ve helped or a detailed infographic about how many families your food bank served over the holidays.
To get started, ensure you have the right technology to gather the data your nonprofit needs. Then, think about what statistics will pair nicely with your stories, capture your audience’s attention, and inspire them to get involved.
 Confidentiality, availability, and integrity of information are used to describe data security. It’s all about the policies and procedures businesses put in place to safeguard personal data against unauthorized access, data breaches, cyberattacks, and unintentional or deliberate data loss. Data security guarantees that data is accurate and trustworthy and that only authorized people can access it. Resilient data storage technologies, encryption solutions, data erasure, data masking, physical and logical access controls, breach response, and multi-factor authentication are all part of a data security plan.
 Although enterprise data security may be effective and reliable, the techniques used to collect, store, and share that data may be in violation of the privacy policy.
 Concerns about personal information and sensitive data and their loss can result in company disruption, considerable reputational harm, and regulatory fines. By implementing effective security measures and adhering to the accompanying privacy standards, businesses can avoid unplanned business interruptions.